Tooling to diagnose and fix memory problems
FairScale comes with some experimental tooling to help track, visualize and suggest fix for memory issues occurring during the forward/backward pass of your models.
Visualizing the memory profile
To track and visualize the memory profile of a model, you can use the LayerwiseMemoryTracker:
from fairscale.experimental.tooling.layer_memory_tracker import LayerwiseMemoryTracker
import torch
import torchvision.models

# Create a model
model = torchvision.models.resnet50().cuda()
criterion = torch.nn.CrossEntropyLoss()

# Create some dummy inputs
batch_size = 16
x = torch.randn(size=(batch_size, 3, 224, 224)).cuda()
y = torch.tensor(list(range(batch_size)), dtype=torch.int64).cuda()

# Start monitoring the model
tracker = LayerwiseMemoryTracker()
tracker.monitor(model)

# Do a forward/backward with dummy inputs
criterion(model(x), y).backward()

# Stop monitoring the model
tracker.stop()

# Show some useful default plots
tracker.show_plots()
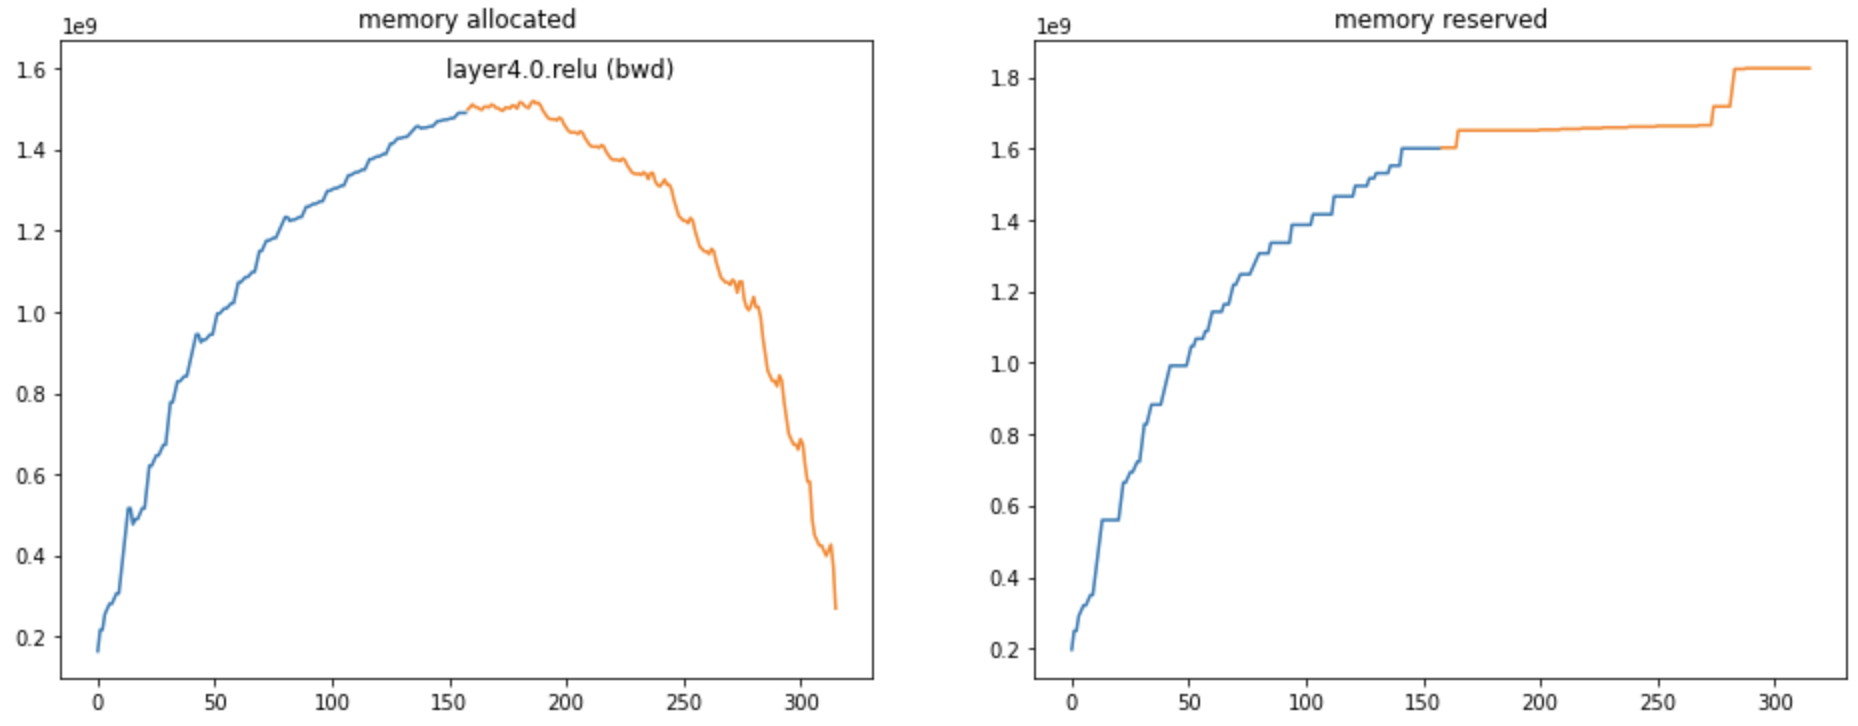
The resulting graphs will include:
a graph of the memory profile (memory allocated and reserved) during the forward/backward
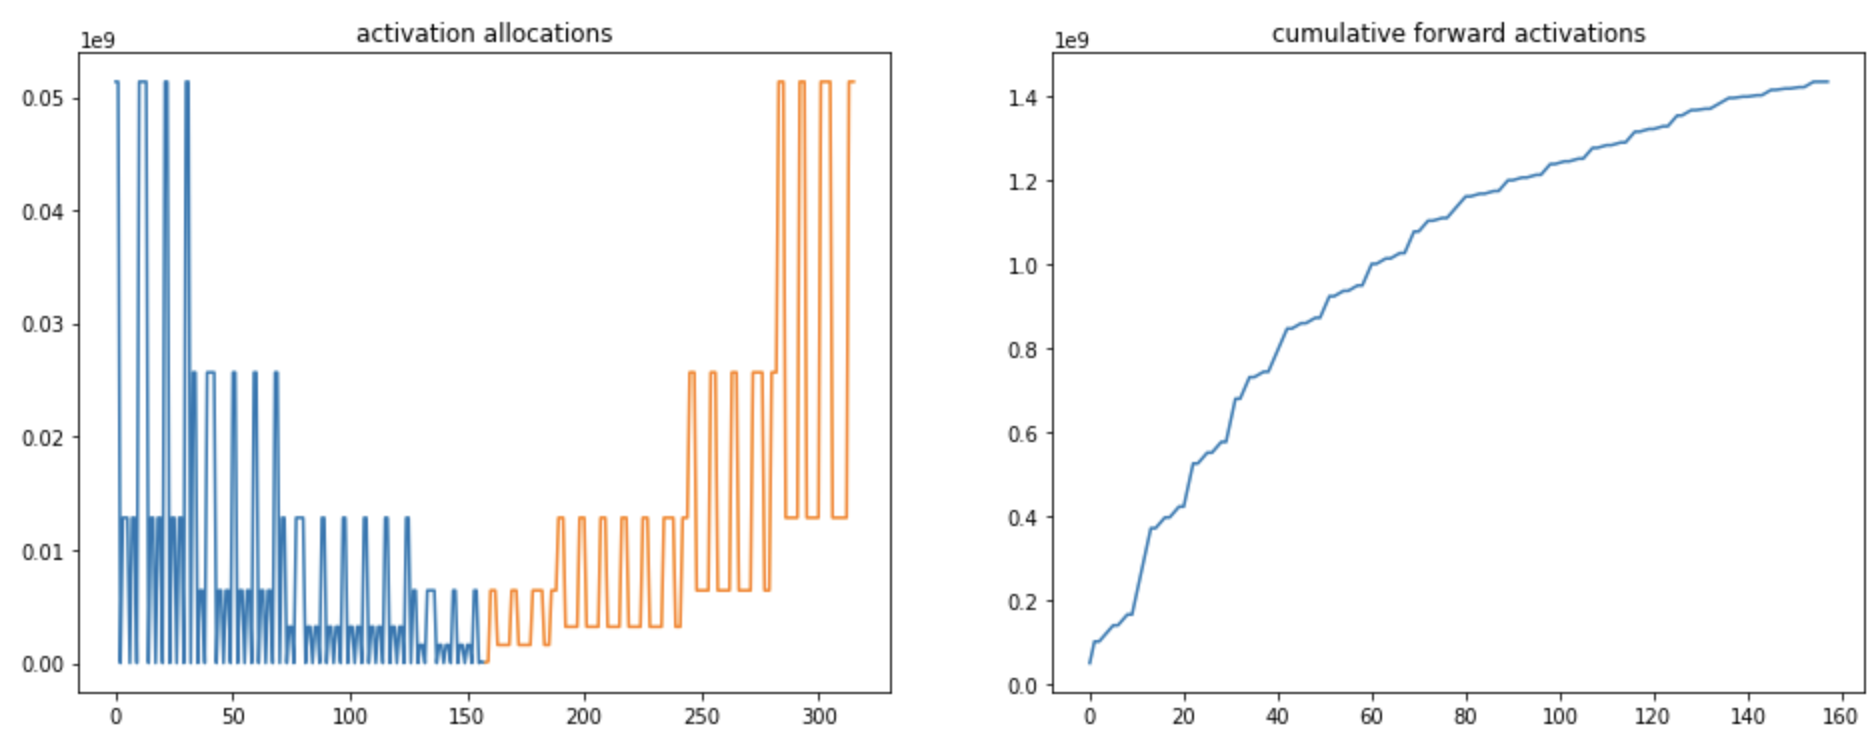
a graph of the amount of memory allocations done for activations done during the forward/backward
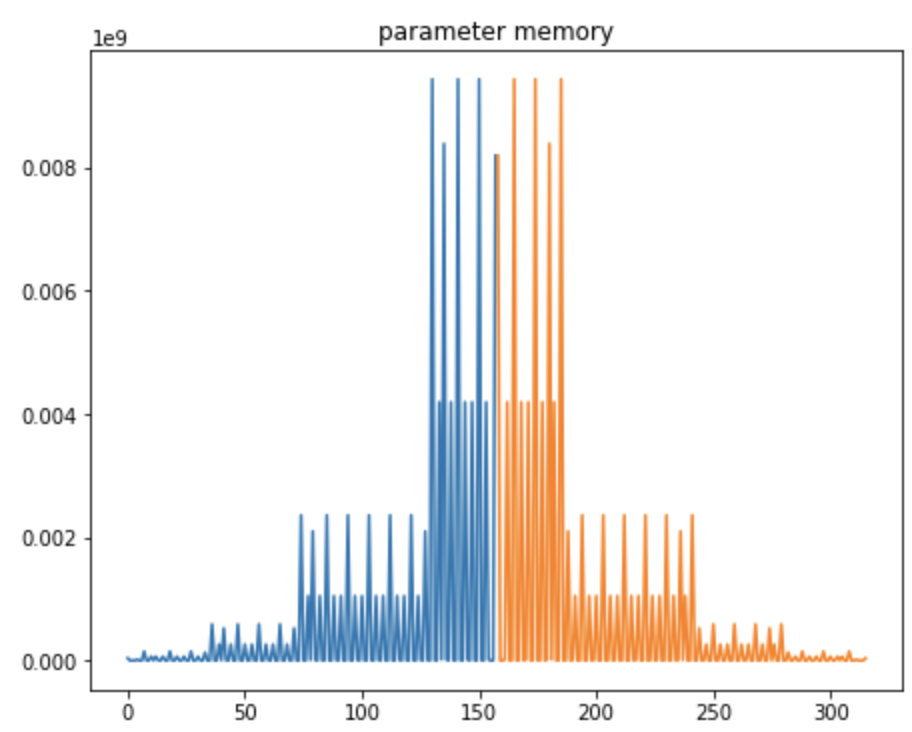
a graph of the amount of memory used for parameters by each the layers traversed done during the forward/backward
In all these graphs:
the blue part of the curve is used for the forward pass, the orange for the backward pass
the X axis is only used for ordering of the computational steps (it does not represent the index of the layer in the model)
How to use those graphs?
It is not always obvious to understand how much memory a model will be using. Those graphs allows to visualize:
what is the main cause of memory consumption: this would be memory activations in the graph above
what are the layers that are worth sharding: those at the end of the convolution net as in the case above
where should we place activation checkpoints to diminish memory consumption
If those graphs are not useful to you, you can always use the raw data collected by the LayerwiseMemoryTracker instead, or use any of the other utility functions provided in the tool:
# Access all raw traces / forward traces only / backward traces only
tracker.memory_traces
tracker.forward_traces
tracker.backward_traces

# Access a quick summary of the traces with information on:
# - the peak memory usage
# - the top layers in terms of memory consumption
tracker.summary
Activation checkpoint suggestions
In additional to visualisation, the LayerwiseMemoryTracker traces can be used to suggest activation checkpoints locations, which can be used to reduce the memory consumption of the forward/backward, but trading some compute:
from fairscale.experimental.tooling.layer_memory_tracker import suggest_checkpoint_location

suggestion = suggest_checkpoint_location(tracker.memory_traces, num_checkpoints=0)
print(suggestion.max_memory)      # Outputs: 1435630080

suggestion = suggest_checkpoint_location(tracker.memory_traces, num_checkpoints=2)
print(suggestion.max_memory)      # Outputs: 485095936
print(suggestion.split_modules)   # Outputs: ['layer1.1.bn3', 'layer2.2.conv3']
This sample code tells us that we can reduce the memory consumption due to activations from 1.4G to around 500M by checkpointing activations at the locations layer1.1.bn3 and layer2.2.conv3.
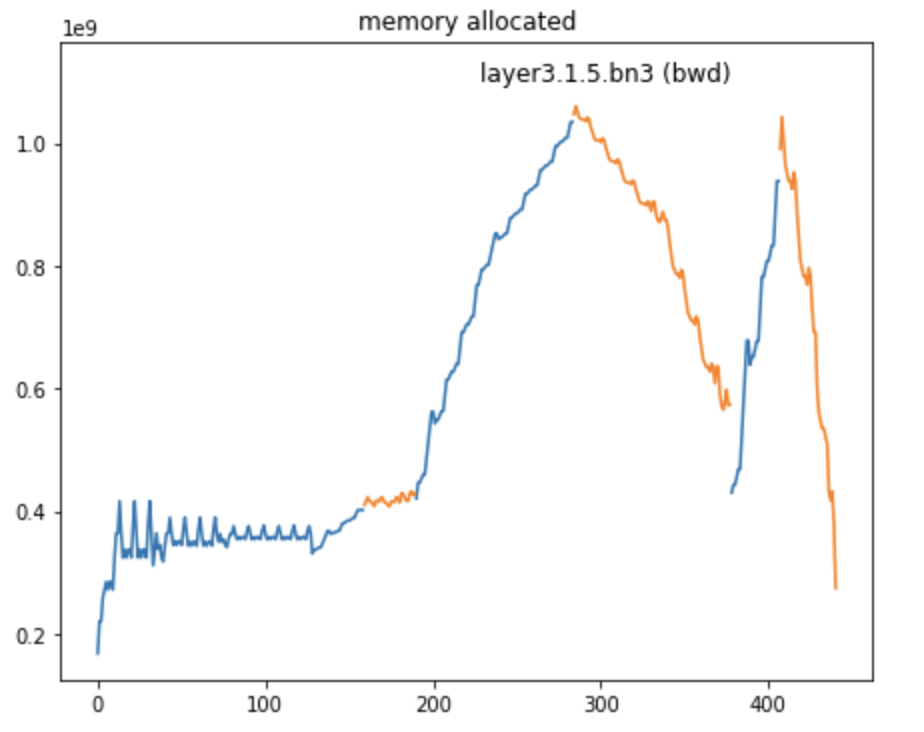
These locations can serve as first guesses and might not always be practical due to the model code. In the case of a torchvision resnet, we can adapt those locations by trying to checkpoint around layer1 and layer2:
model = torchvision.models.resnet50().cuda()
model.layer1 = checkpoint_wrapper(model.layer1)
model.layer3 = checkpoint_wrapper(torch.nn.Sequential(model.layer2, model.layer3))
model.layer2 = torch.nn.Identity()
Leading to the following memory profile, saving around 400MB of activation memory at the cost of more compute:
Dedicated features to FSDP distributed training
When training a big model with FullyShardedDataParallel, you can use the LayerwiseMemoryTracker to track the amount of memory exchanged by FSDP to consolidate sharded layers:
from fairscale.nn import FullyShardedDataParallel as FSDP
from fairscale.experimental.tooling.layer_memory_tracker import ProcessGroupTracker

# Create a process group for FSDP
group = torch.distributed.new_group()
group = ProcessGroupTracker(group)

# Create a FSDP model
model = torchvision.models.resnet50().cuda()
model.layer1 = FSDP(model.layer1, process_group=group)
model.layer2 = FSDP(model.layer2, process_group=group)
model.layer3 = FSDP(model.layer3, process_group=group)
model.layer4 = FSDP(model.layer4, process_group=group)
model = FSDP(model, process_group=group)
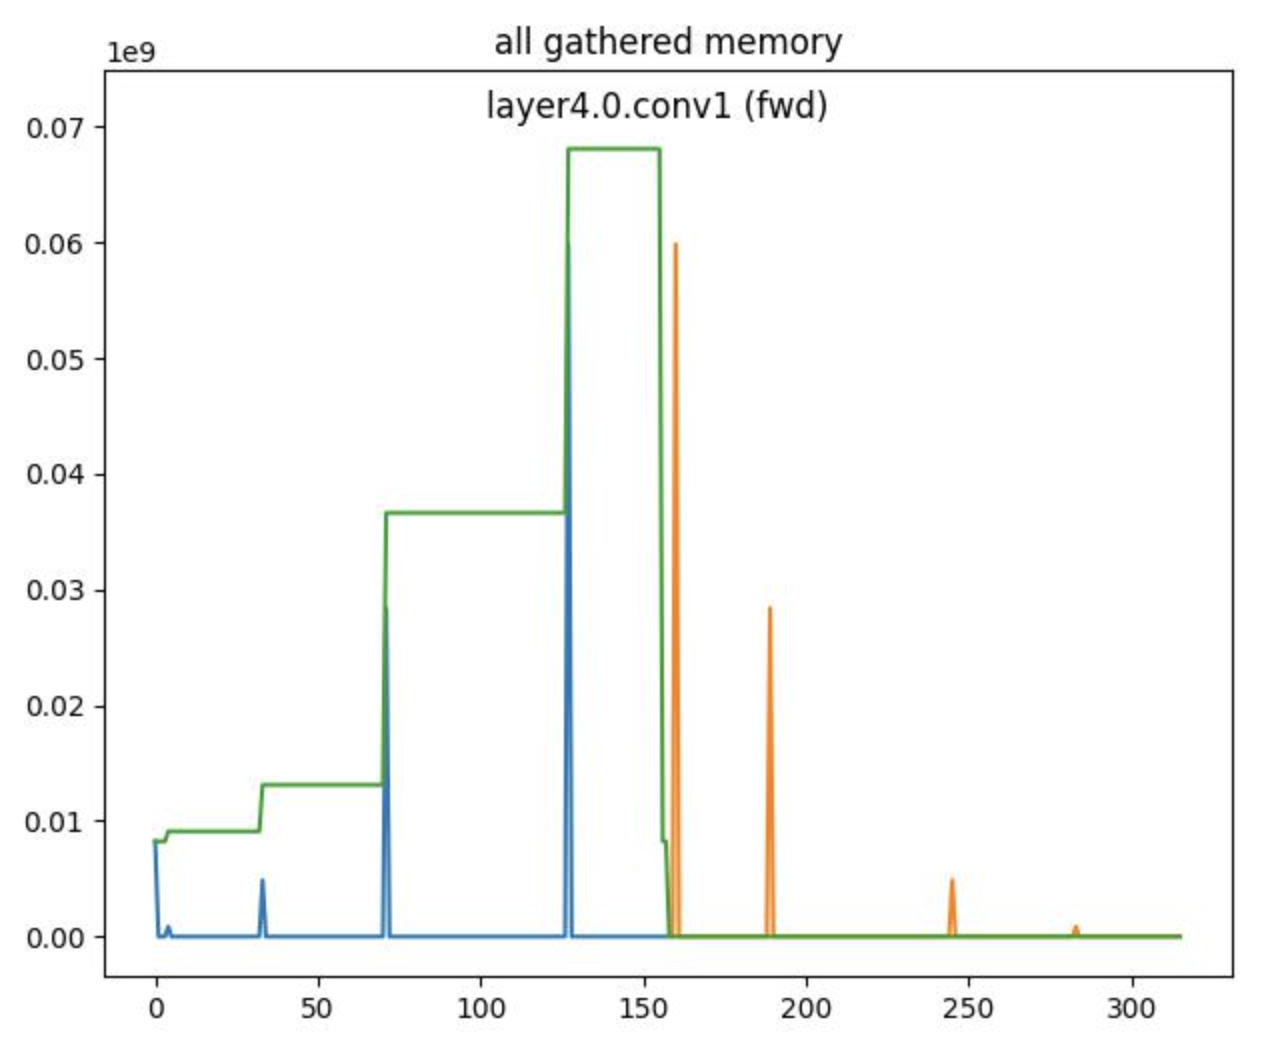
Now, the LayerwiseMemoryTracker will provide an additional graph where we can see:
the memory spikes (in blue for forward, in orange for backward) of the all_gather calls
an estimation (in green) of cumulative parameter memory (only available for the forward pass)
Limitations
The LayerwiseMemoryTracker has a bunch of limitations it is important to be aware of:
It only works on GPU models: models cannot sit on the CPU
Some of the GPU memory might not tracked by PyTorch (for example some NCCL buffers) and therefore will not be tracked with this tooling either
Beside memory allocated and memory cached, which are based on PyTorch, the results are based on heuristics, and might miss some memory in some cases
Some features (such as cumulative all gathered memory for FSDP) do not work in the backward pass
